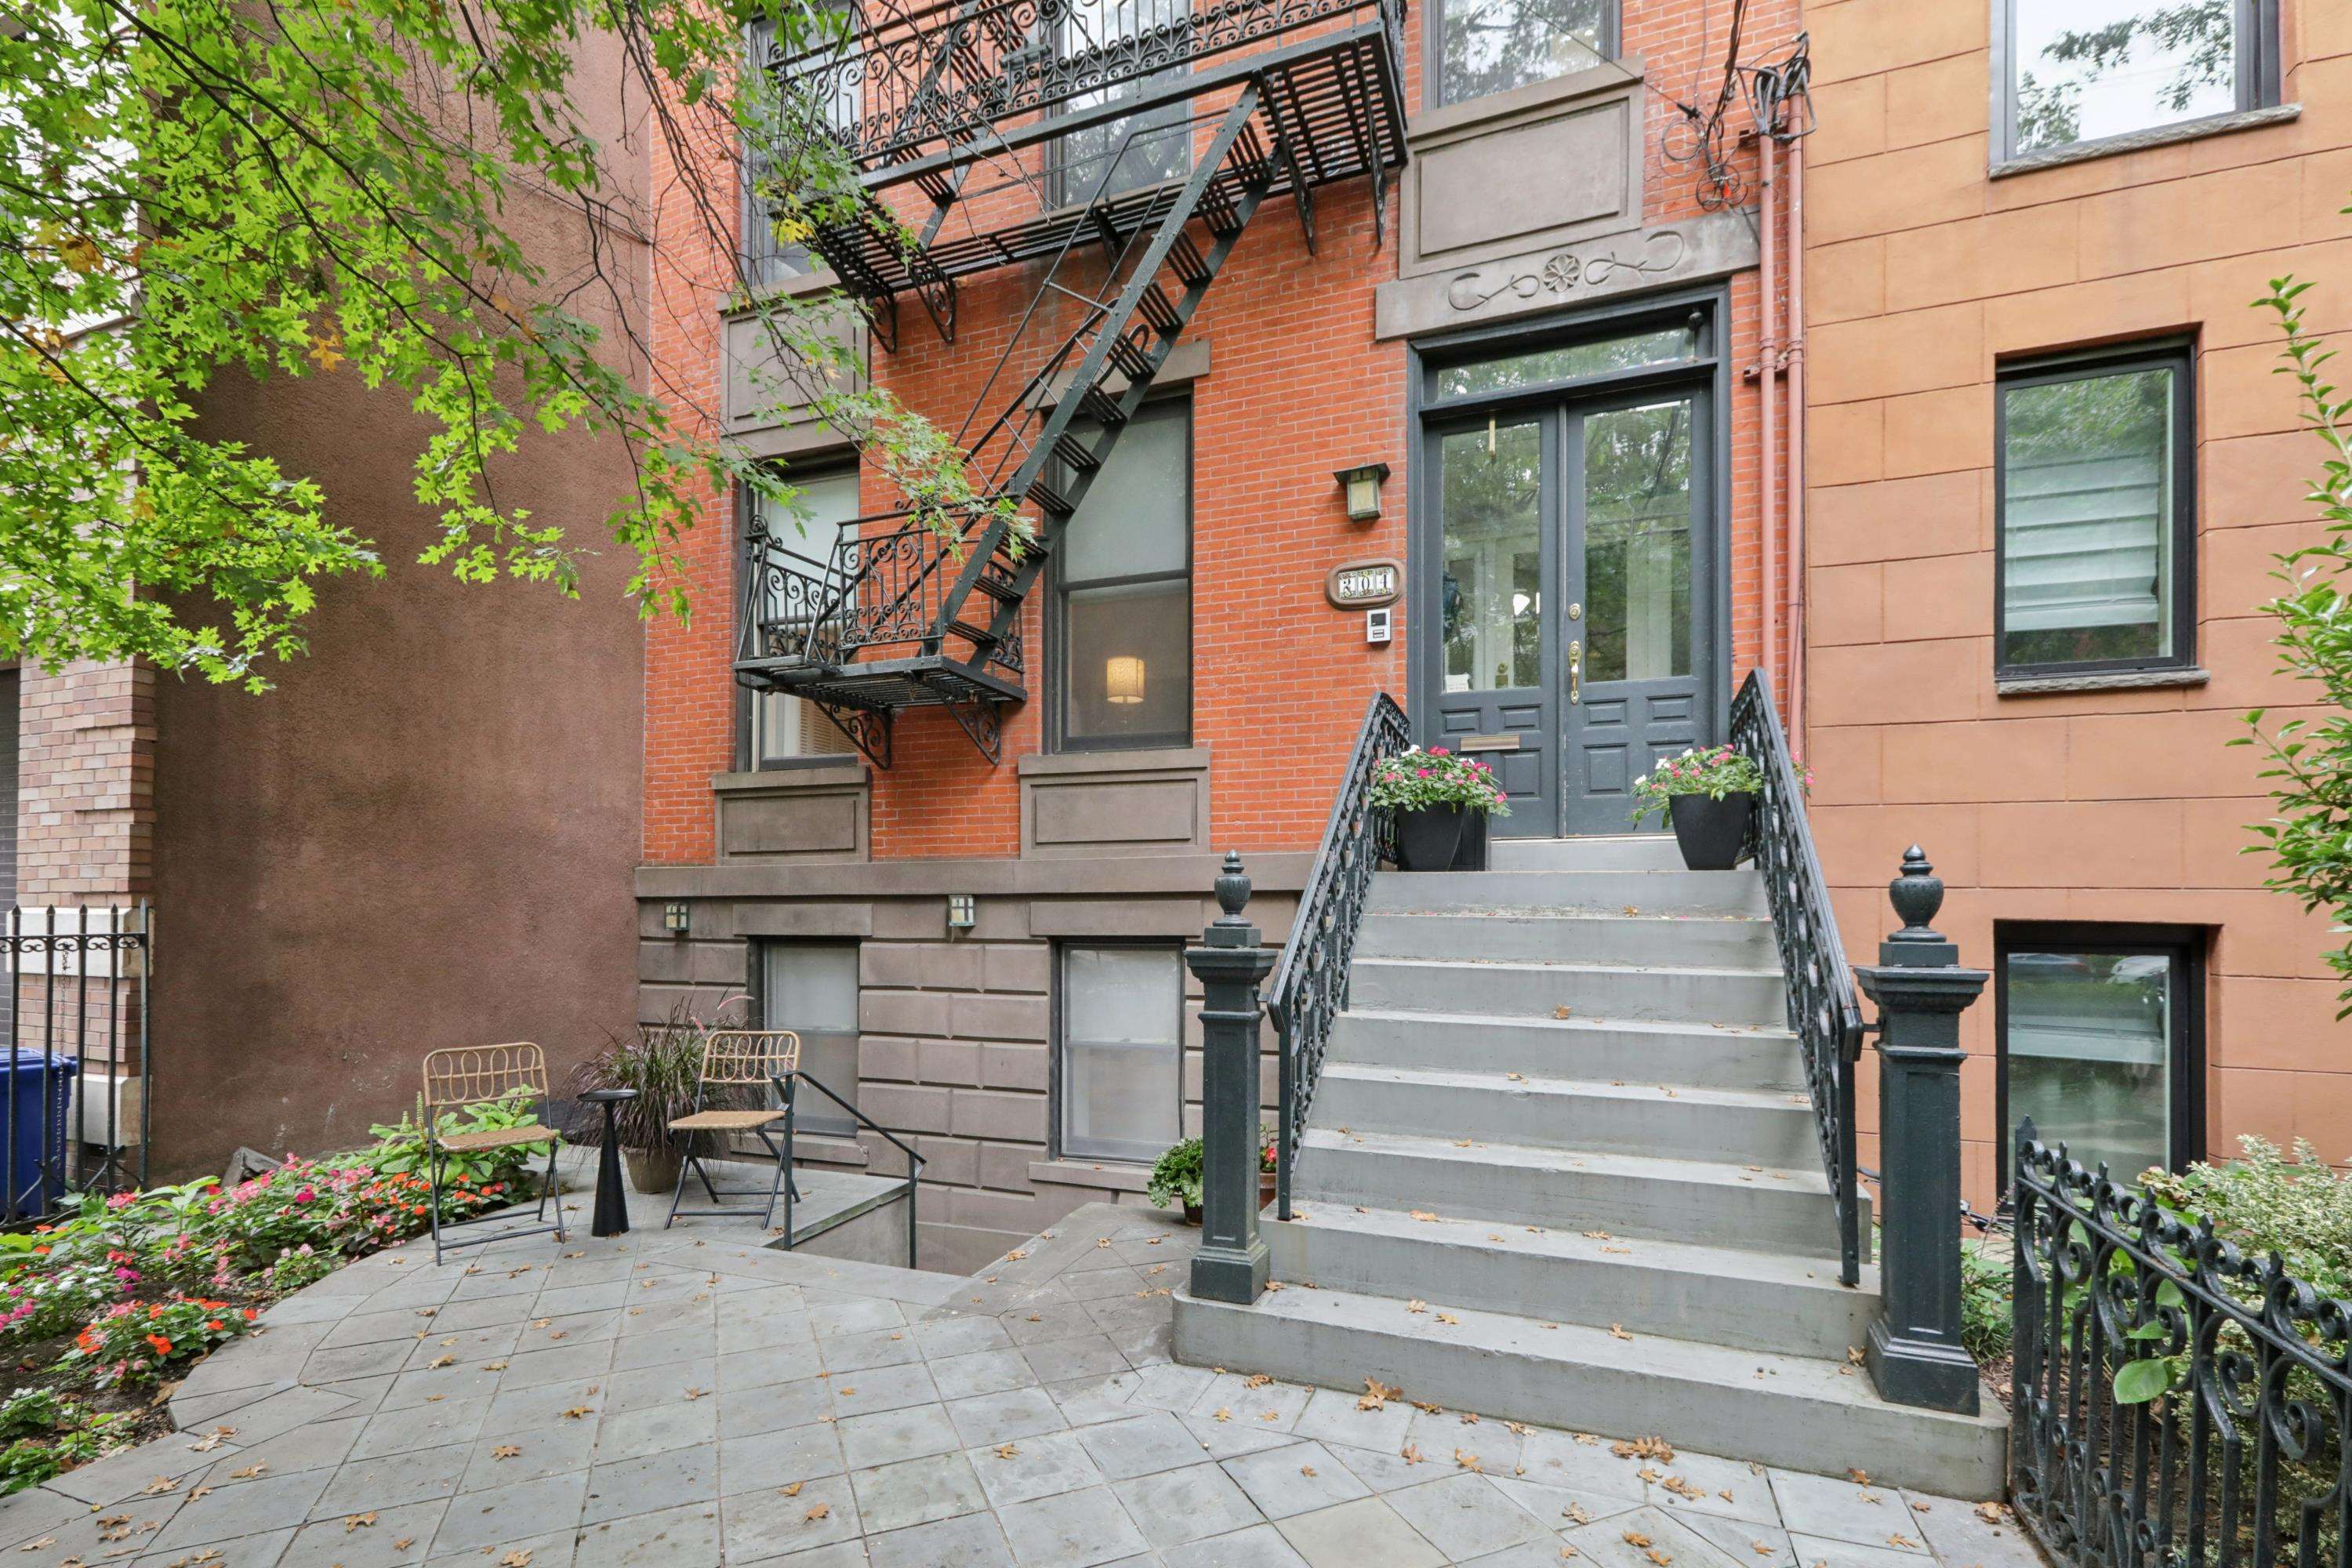
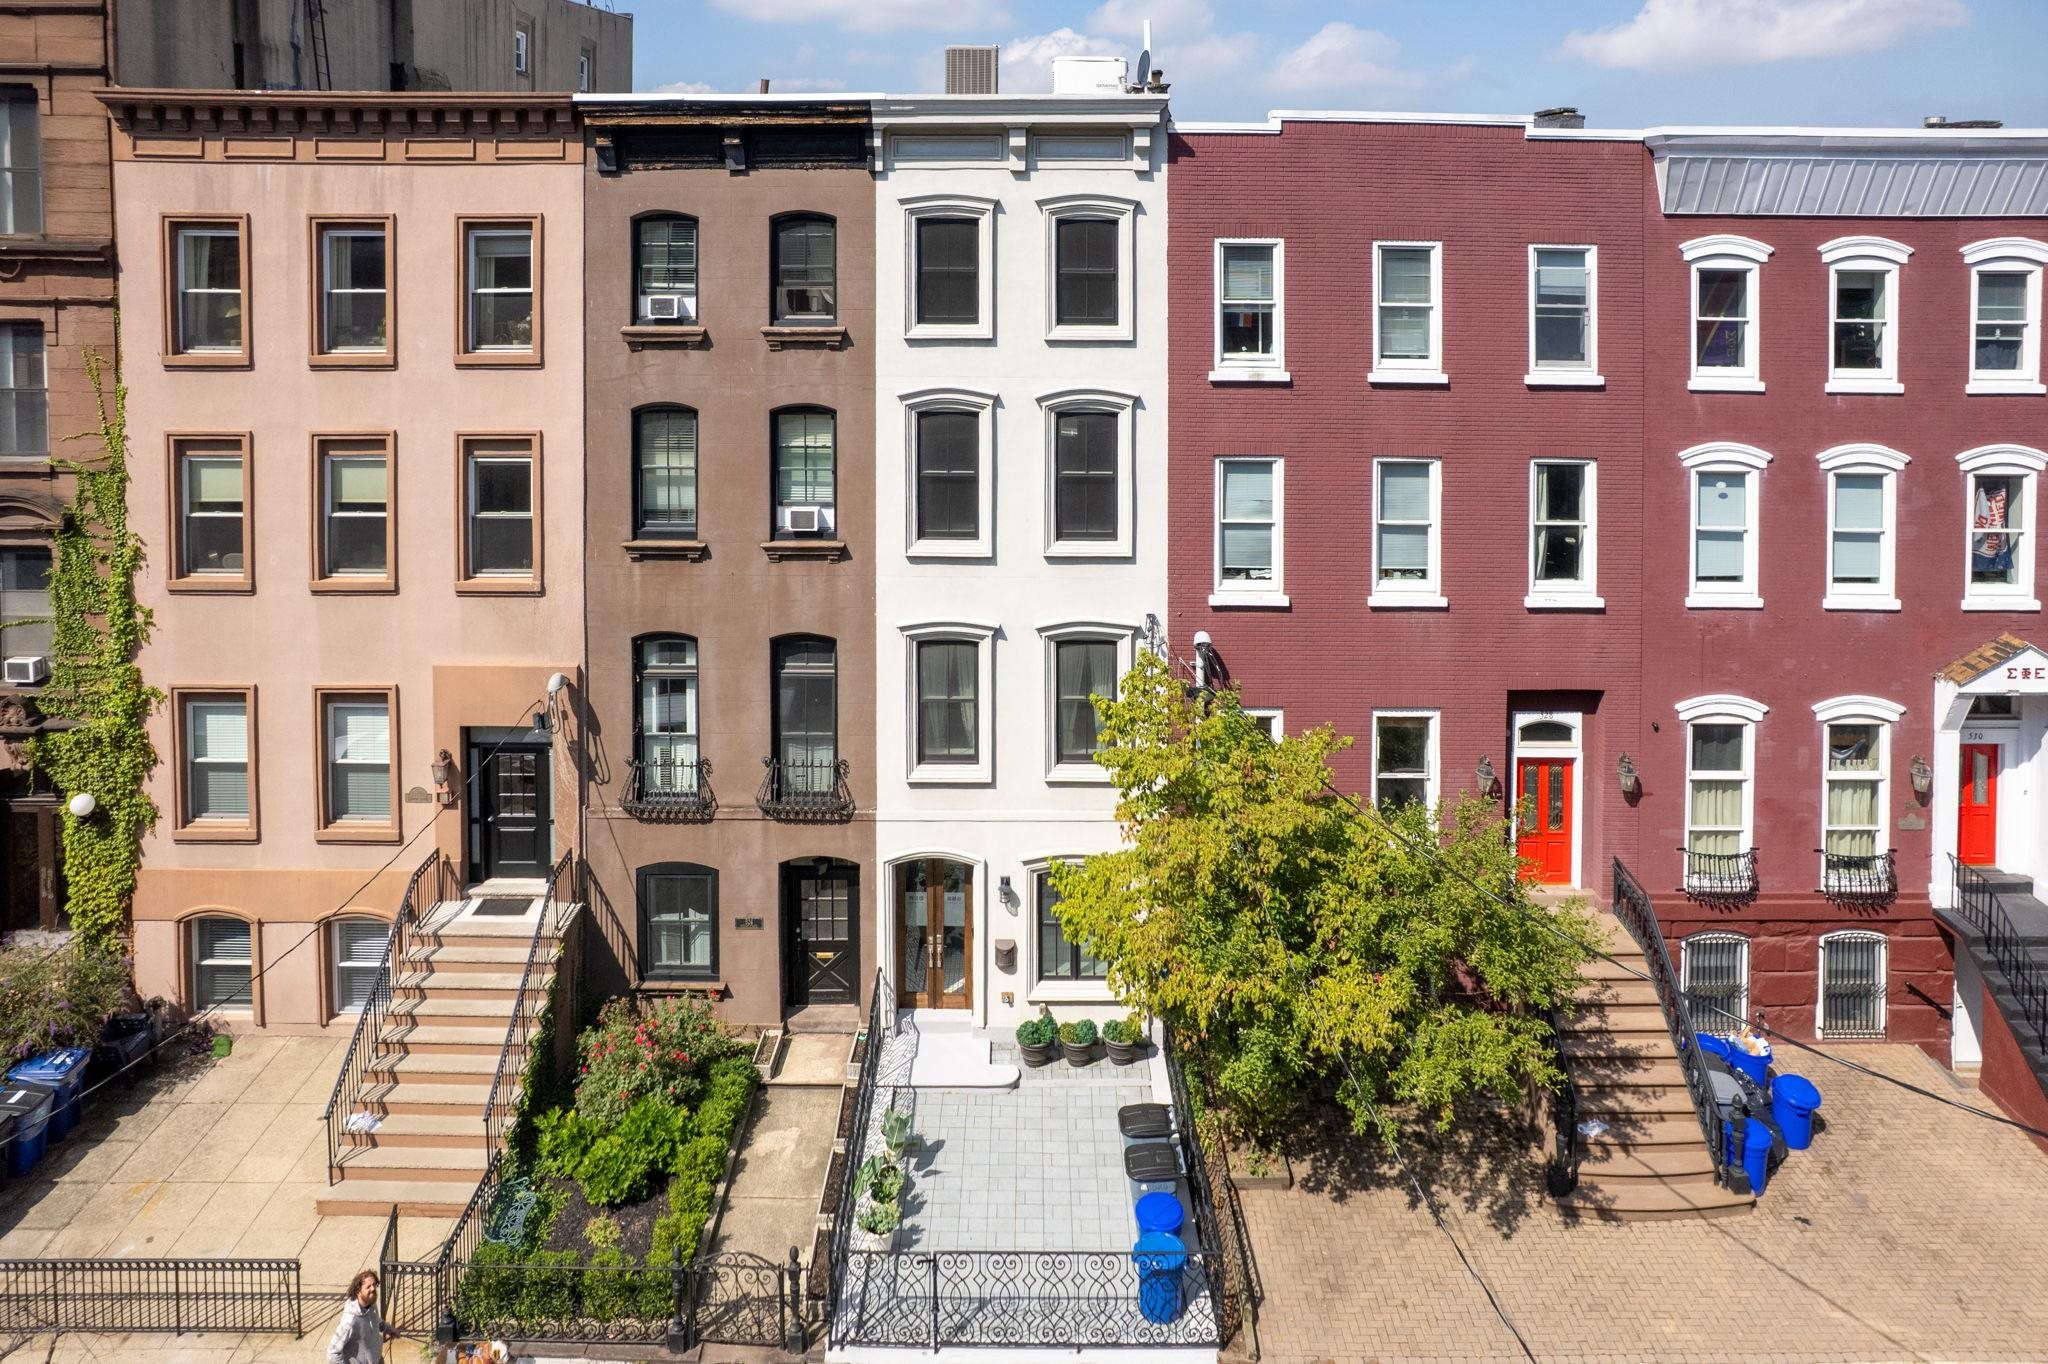
Hoboken, NJ — The Urban Gem Where Every Day Brims with Life 🚶
City Services & Modern Infrastructure
Hoboken counts on a digitally forward city government—online platforms for permits, taxes, parking, transport, construction, and housing show a city stripped of bureaucratic friction
Parks & Flood Resilience
Tom Olivieri Park, recently overhauled with playgrounds, spray areas, artful seating, and shaded tree canopy, exemplifies Hoboken's commitment to public space and climate resiliency—with community input integrated at every stage .The larger Northwest Resiliency Park also contributes to green flood mitigation and leisure space
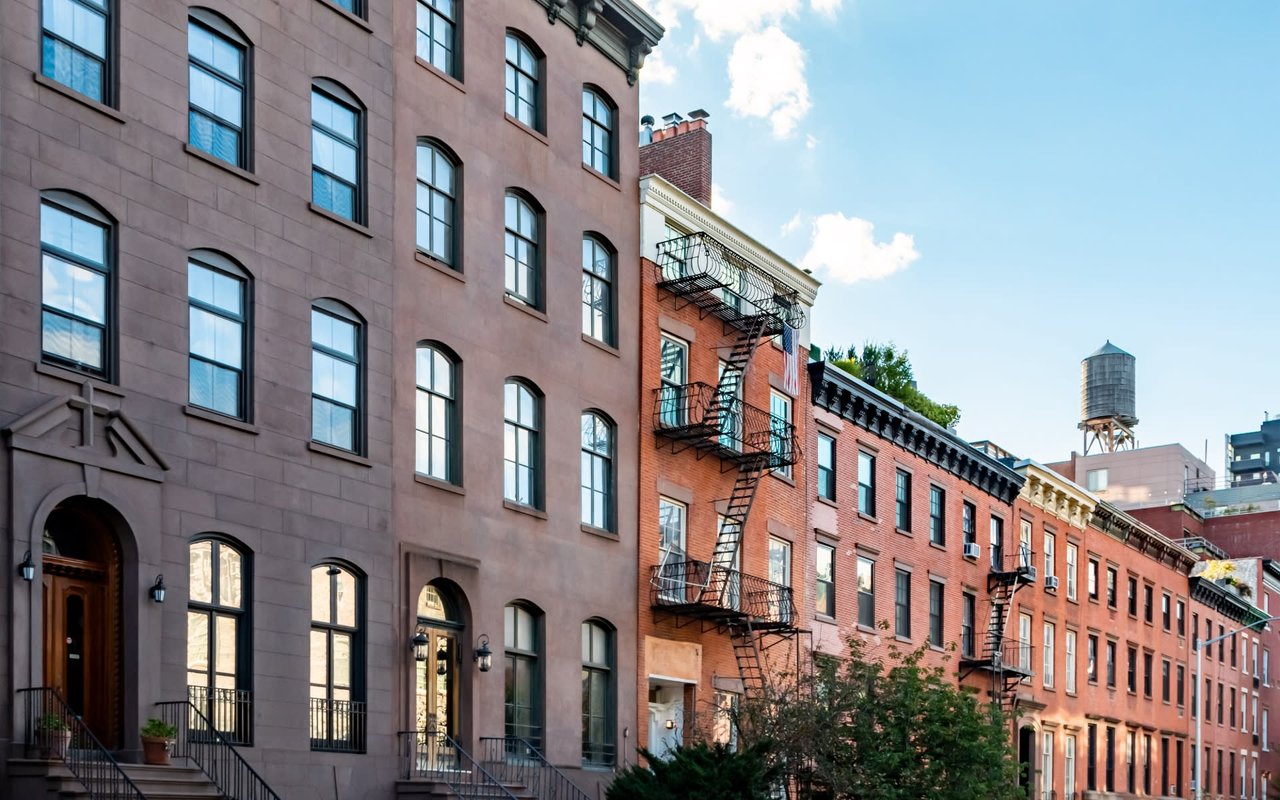
Walkability & Transit Life
Life in Hoboken often unfolds on foot—the city’s compact grid, PATH station, NJ Transit, light rail, extensive bus network, ferry access, and protected bike lanes support a lively car-free lifestyle praised in resident narratives
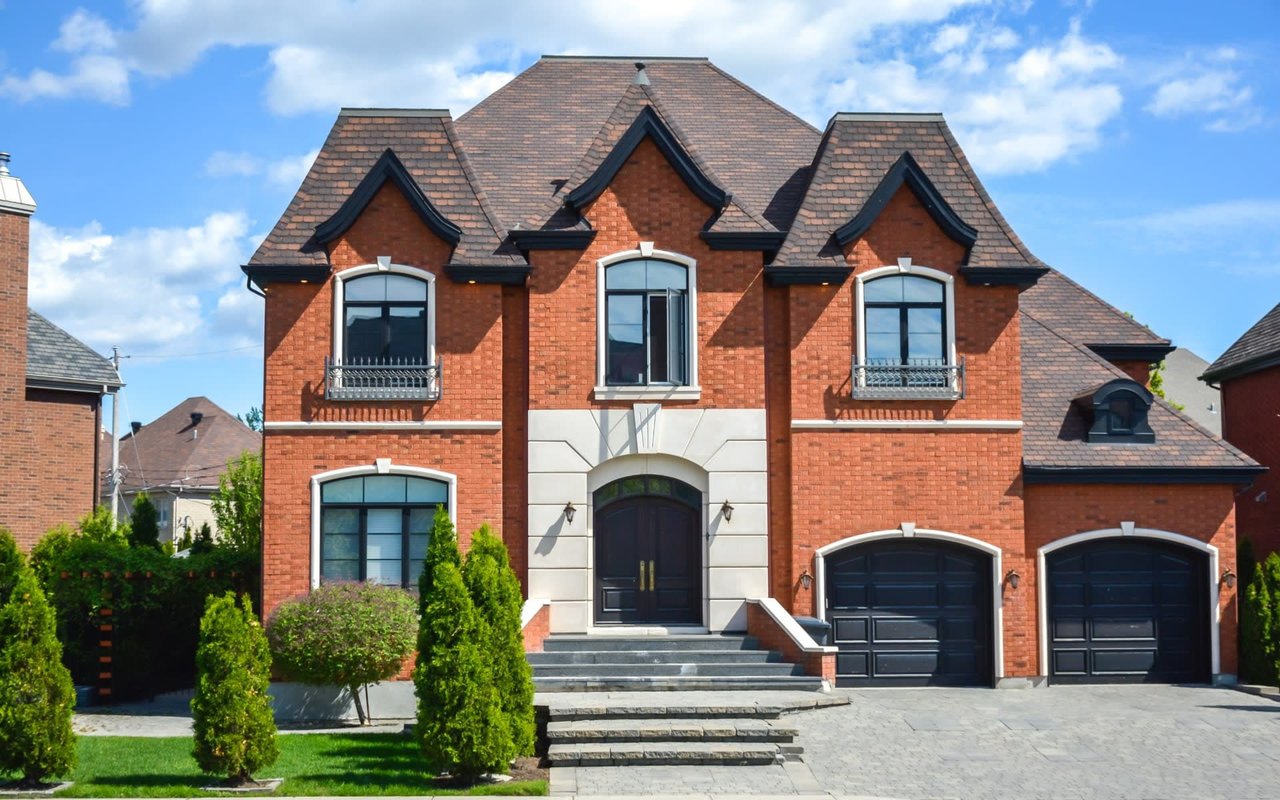
Inclusive & Supportive Housing
The Hoboken Housing Authority ensures avenues for accessible, well-managed housing, blending affordability, alongside resident services, programs, and infrastructure renewal.
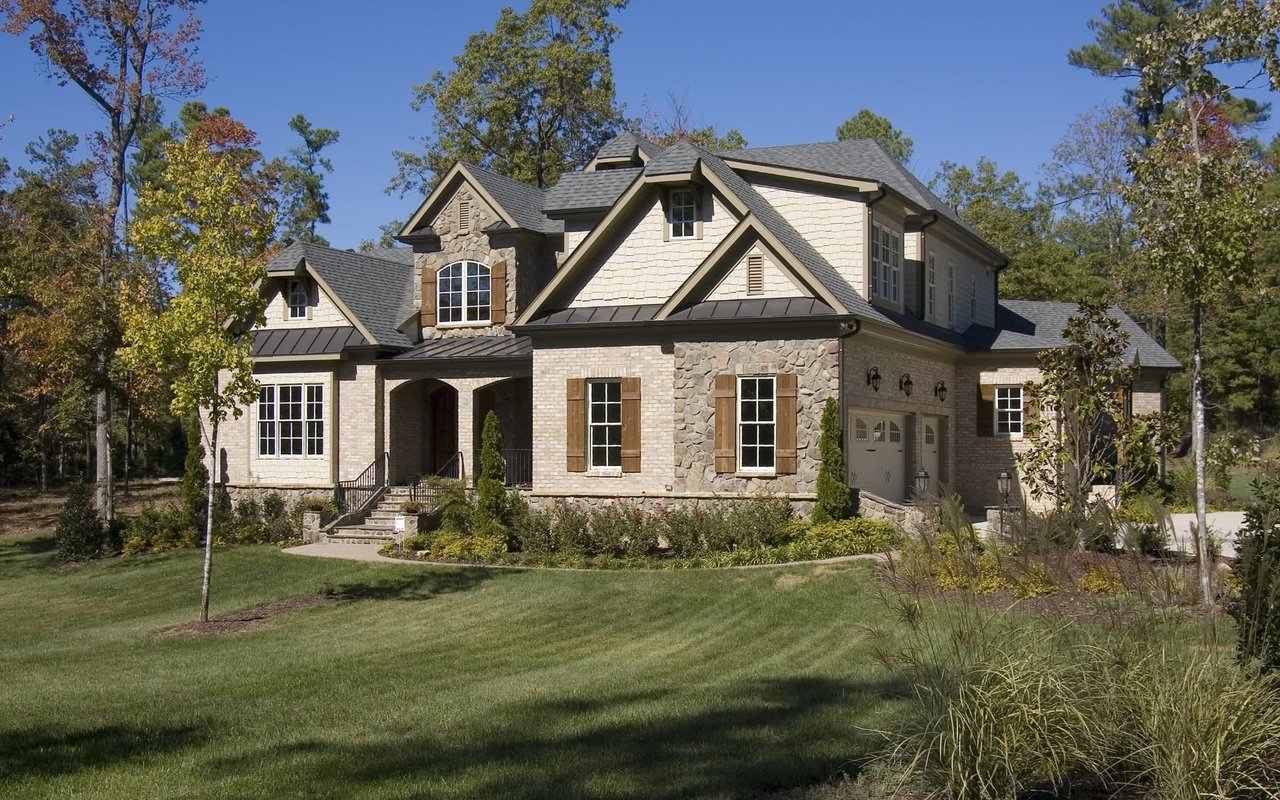
Vibrant Civic & Cultural Fabric
From government-run "Summer Fun" events to Puerto Rican Heritage Week, Hoboken is a sharing city—community design efforts, public engagement sessions, and civic culture are woven into every season.
Local voices, community social sites, and amateur coffee connoisseurs speak of a grassroots culture and hyper-local flair .
58,340 people live in HOBOKEN, where the median age is 31.9 and the average individual income is $108,075. Data provided by the U.S. Census Bureau.
Total Population
Median Age
Population Density Population Density This is the number of people per square mile in a neighborhood.
Average individual Income
HOBOKEN has 27,654 households, with an average household size of 2.04. Data provided by the U.S. Census Bureau. Here’s what the people living in HOBOKEN do for work — and how long it takes them to get there. Data provided by the U.S. Census Bureau. 58,340 people call HOBOKEN home. The population density is 46,664.18 and the largest age group is Data provided by the U.S. Census Bureau.
Total Population
Population Density Population Density This is the number of people per square mile in a neighborhood.
Median Age
Men vs Women
Population by Age Group
0-9 Years
10-17 Years
18-24 Years
25-64 Years
65-74 Years
75+ Years
Education Level
Total Households
Average Household Size
Average individual Income
Households with Children
With Children:
Without Children:
Marital Status
Blue vs White Collar Workers
Blue Collar:
White Collar:
Get assistance in determining current property value, crafting a competitive offer, writing and negotiating a contract, and much more. Contact us today to find out how we can be of assistance to you.